Checking Sample Preparation and Measuring Conditions
Thermal conductivity tests are sensitive to many different factors like contact between probe and sample, unstable ambient temperature, sample size, heating power or water movement inside moist samples (convection). The TK04 software detects and eliminates some of these disturbances in the data automatically, and it provides tools to examine measurements for problems with sample preparation or measuring conditions and to correct or exclude them. This increases accuracy significantly.
Measuring Software Includes Drift Correction
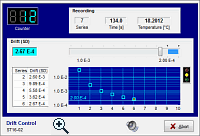
 It takes up to 24 hours for newly arrived samples to adapt to the laboratory temperature. If measurements are started too early, the temperature adjustment interferes with the heating curve, whose slope then appears too small or too large. This directly affects the thermal conductivity value. The TK04 software continuously monitors the temperature changes of the sample until the drift is small or steady enough to begin measuring. Data are automatically corrected for the remaining temperature drift.
Optimal Choice of Evaluation Interval
The evaluation software compares the measuring data to the theoretical curve and automatically chooses the best (i.e. least disturbed) evaluation interval. Thermal conductivity is calculated from the time interval which best matches the theory.
Additional Evaluations
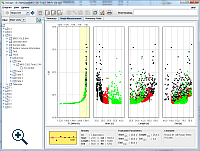
The measuring curve is automatically evaluated in additional time intervals of different length and start time. The software only uses intervals where the temperature curve is sufficiently close to the theoretical curve. The results are saved for use with the presentation and analysis software TkGraph, which enables the user to examine measurements for influences of sample preparation and measuring conditions if required.
Automatic Repetitions
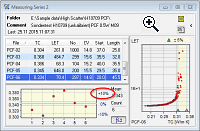
The measuring software is able to execute measuring series with up to 99 single measurements fully unattended. The user chooses the number of repetitions. The software displays a result table and diagram, where the mean value of thermal conductivity and the variation in percent are immediately updated after each single measurement. While a measuring series is running, the user can always check the scatter of the thermal conductivity values. A scatter of more than ± 3% in most cases indicates instable ambient temperatures. This can be verified by examining the data with the TkGraph analysis program (included with the TK04 software package).
Presentation and Analysis Software TkGraph
 TkGraph is part of the TK04 software package. Its purpose is documenting finished measurements and examining them for problems with sample preparation or measuring conditions. TkGraph provides tools for manually correcting or excluding disturbed measurements.
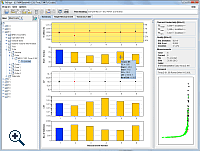
From the result files TkGraph generates a summary plot including the calculated mean value and the variation for each measuring series as well as detailed diagrams for the corresponding single measurements.


