Software for Data Transfer and Analysis Included
A platform independent software offering advanced options for data transfer, filtering and analysis is included and can be installed on any number of PCs and notebooks without buying additional licenses. The software requires a current Java version (included on the setup CD-ROM). To connect the TkMonitor temperature recorder to the computer a free {tip serial interface::COM-Port, RS232}serial interface{/tip} is necessary (a standard serial to USB converter can be used if no serial port is available).
Transferring Data to a computer or notebook
The TkMonitor software can transfer temperature data stored in a TkMonitor temperature recorder to a file on a connected computer or notebook, open previously transferred data files for processing or mirror data from a control unit while a measuring job is running. In mirror mode, the thermal state of the measuring object can be observed nearly in real time. Mirror mode can be switched on and off at any time during an active measuring job.
Filtering and Sorting Temperature data
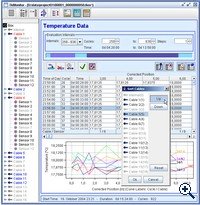
All cables and sensors that were part of the measuring network for the job currently loaded are displayed in a hierarchical tree view. Cables can be sorted according to your needs (e.g. resembling the organization of your measuring network). Whole cables as well as individual sensors can be deactivated, which is useful to exclude disturbed measurements from processing or to process only parts of large sensor networks.
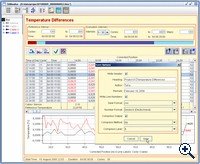
The temperature data of all active sensors are displayed in a data table (sensor positions as row labels, time as column labels) whose content and appearance are fully customizable. You may choose the complete measuring job or any number of independent time intervals for display, swap rows and columns and select additional labels (cable and sensor numbers, cycle numbers, time of day) to display.
Data Analysis and Export Options
The software can work with absolute temperature values as well as calculate temperature differences to a user-defined reference interval. Preview curves for selected measuring data can be displayed in a diagram below the data table (temperature vs. time curves for selected sensors or temperature vs. sensor position curves for selected measuring times). Any selection of data chosen by the user can be saved to a file in csv format (entries separated by semicolons) or txt format (entries separated by white spaces) for further processing with other applications.


